Monitoring application performance using Nginx and Grafana
Using Nginx access logs to monitor the performance of application endpoints.


There are many reasons why monitoring the performance of your application is important such as ensuring responsive end-user experiences and preventing code/infrastructure changes from causing performance regressions.
There are a myriad of technologies that you can use to monitor application performance, but one simple way that I recently discovered was using Nginx access logs. Nginx is a popular reverse-proxy and is a standard in many web application architectures.
The approach works as follows:
- Setup Nginx access logs
- Stream logs to CloudWatch
- Setup metric filters for the endpoints you want to monitor
- Visualize performance of endpoints using Grafana dashboards
This simplistic approach offered a number of benefits when compared to implementing a fully featured distributed tracing technology, such as:
- Reusing existing architecture components - We were already used Nginx as a reverse-proxy and had already enabled access logs for threat analytics.
- Cost-effective - Many tracing products are extremely expensive.
- Centralized logging and minimal configuration - No need to install tracing libraries in microservices or augment existing code.
There are definite advantages to this approach, but there are some downsides, and as your monitoring efforts become more advanced you might encounter some of these such as:
- Manual configuration of the routes to monitor - If you have a clear idea of the routes you want monitored then this is not a big deal, but if you want to automatically trace all routes then this could become a pain point.
- Inability to identify specific code/microservices causing delays - If you have a microservice architecture where one requests is actually orchestrated amongst multiple microservices, you won't be able to determine which one of these is causing your performance issue.
Where I think this approach works is when you want a broad overview of application performance and then later you can combine this approach with more detailed distributed tracing to drill into specific endpoints.
Now that we understand which use-case this approach covers, lets dig into how to actual implement it.
Setting up Nginx Access Logs
While you might already have access logs configured for your Nginx instances, the key thing to note here is that we want to expose all the required information for capturing performance details of the request and we want the logs to be formatted as json so that it's easy to implement the metric filters laters on.
The configuration below exposes all the properties captured by Nginx for a request and formats the log as json. You might not need all of these properties and in that case its best to only capture the properties that you need as that will minimize log processing and storage costs.
    log_format json_logs escape=json
       '{'
         '"time_local":"$time_local",'
         '"remote_addr":"$remote_addr",'
         '"remote_user":"$remote_user",'
         '"request_method":"$request_method",'
         '"request":"$request",'
         '"request_body":"$request_body",'
         '"upstream_addr":"$upstream_addr",'
         '"upstream_status":"$upstream_status",'
         '"upstream_response_time":"$upstream_response_time",'
         '"upstream_connect_time":"$upstream_connect_time",'
         '"upstream_header_time":"$upstream_header_time",'
         '"status": "$status",'
         '"body_bytes_sent":"$body_bytes_sent",'
         '"request_time":"$request_time",'
         '"http_referrer":"$http_referer",'
         '"http_user_agent":"$http_user_agent"'
       '}';
access_log /var/log/nginx/access.log json_logs;Stream logs to CloudWatch
This step varies significantly depending on how you are running your Nginx instances. For me, they are run using an AWS ElasticBeanstalk environment.
In ElasticBeanstalk, this configuration would live inside the logs.config file which instructs the environment on how to capture logs of the workloads being run. The configuration would look something like this
### BEGIN .ebextensions/logs.config
option_settings:
  - namespace: aws:elasticbeanstalk:cloudwatch:logs
    option_name: StreamLogs
    value: true
  - namespace: aws:elasticbeanstalk:cloudwatch:logs
    option_name: DeleteOnTerminate
    value: false
  - namespace: aws:elasticbeanstalk:cloudwatch:logs
    option_name: RetentionInDays
    value: 7

files:
  "/etc/awslogs/config/beanstalklogs.conf":
    mode: "000644"
    owner: root
    group: root
    content: |
      [/var/log/containers/nginx-proxy/access.log]
      log_group_name=/aws/elasticbeanstalk/proxy/var/log/containers/nginx-proxy/access.log
      log_stream_name={instance_id}
      file=/var/log/containers/nginx-proxy/access.log

      [/var/log/containers/nginx-proxy/error.log]
      log_group_name=/aws/elasticbeanstalk/proxy/var/log/containers/nginx-proxy/error.log
      log_stream_name={instance_id}
      file=/var/log/containers/nginx-proxy/error.log

commands:
  "00_restart_awslogs":
    command: service awslogs restart

### END .ebextensions/logs.config
Once configured, you should then be able to explore the access logs through the CloudWatch console as shown below.
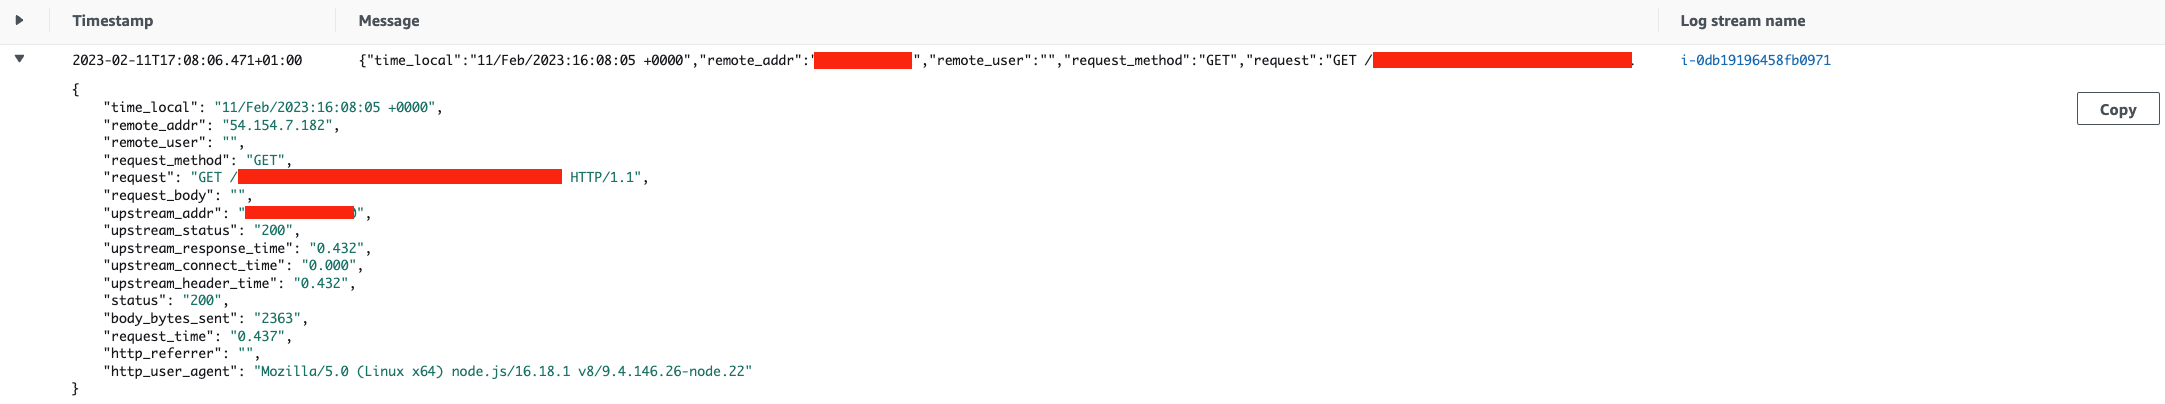
Setting up CloudWatch metric filters
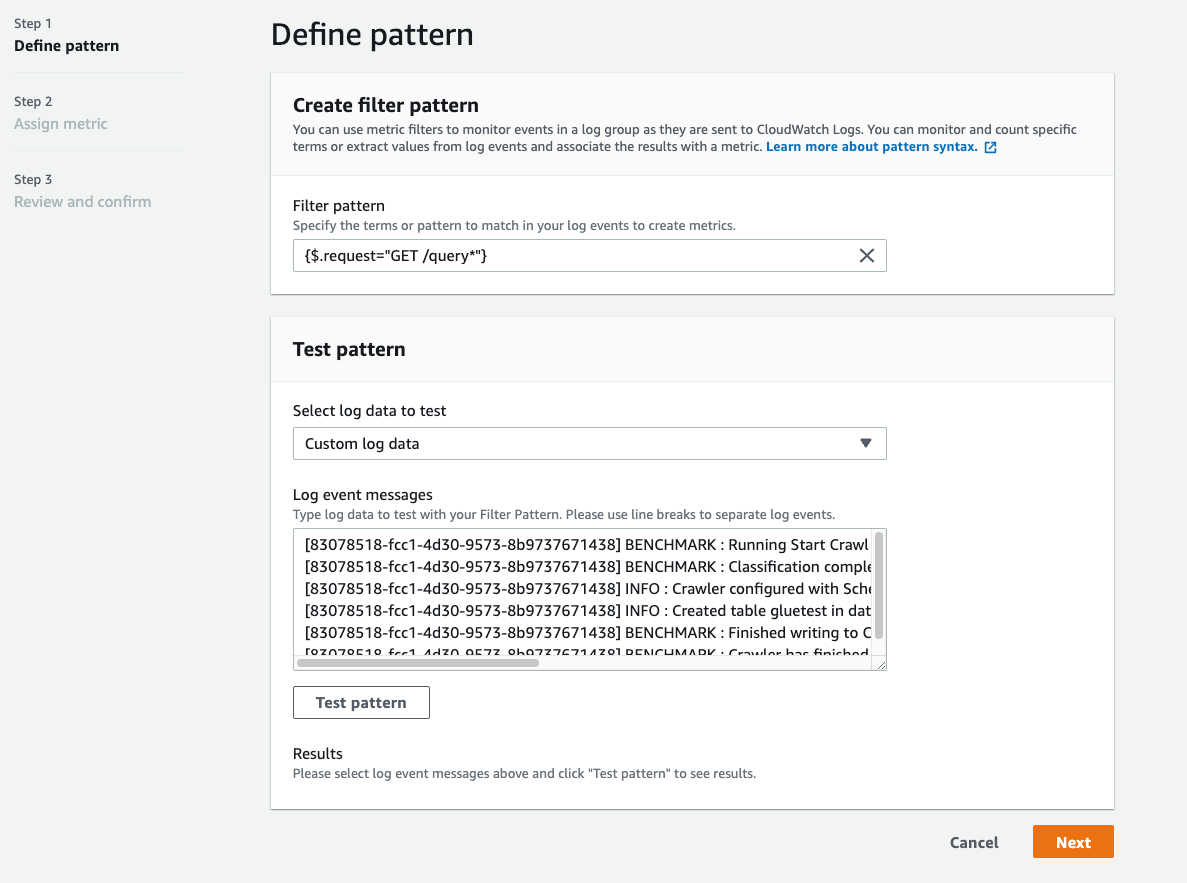
Once the logs are accessible through CloudWatch log groups, you should be able to create a metric filter for the specific routes you want to monitor.
First, you specify the filter pattern that you want to match in your access logs. Here you can match on any of the properties that you captured in your log. In the image below, we match any log line where the request property is a GET and starts with the word query.
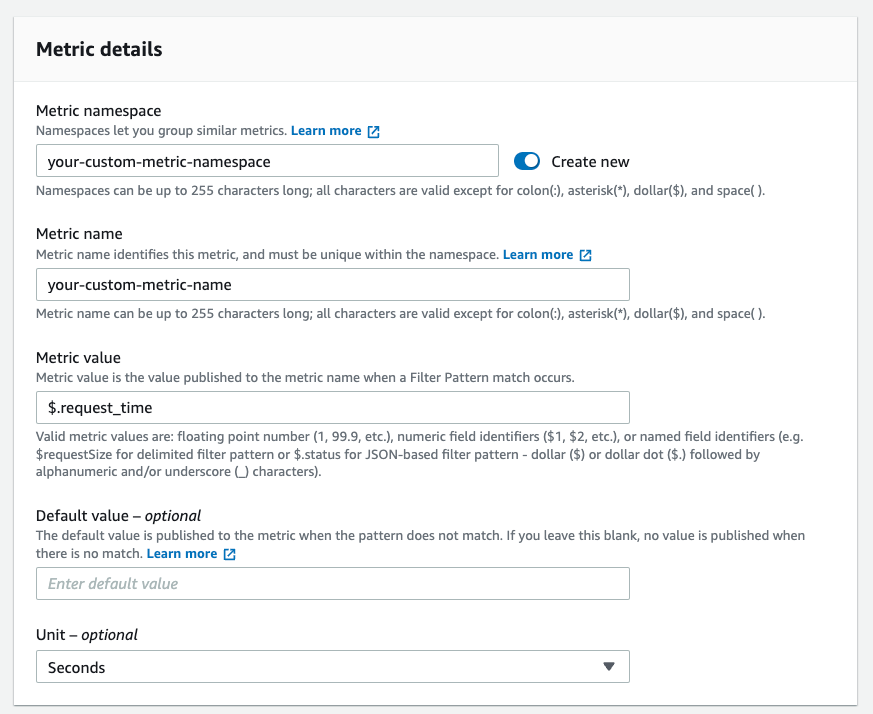
Next, you specify a metric namespace and name for your custom metric and importantly, select the metric value that you want to capture. In the image below, we extract the request_time from the log, for Nginx, this represents the total time taken to respond to a request.
Visualizing endpoint performance using Grafana
Now that your metric filter is setup, you can create a Grafana dashboard to visualize the performance of your endpoint. A sample query showing how this would look is shown in the image below.
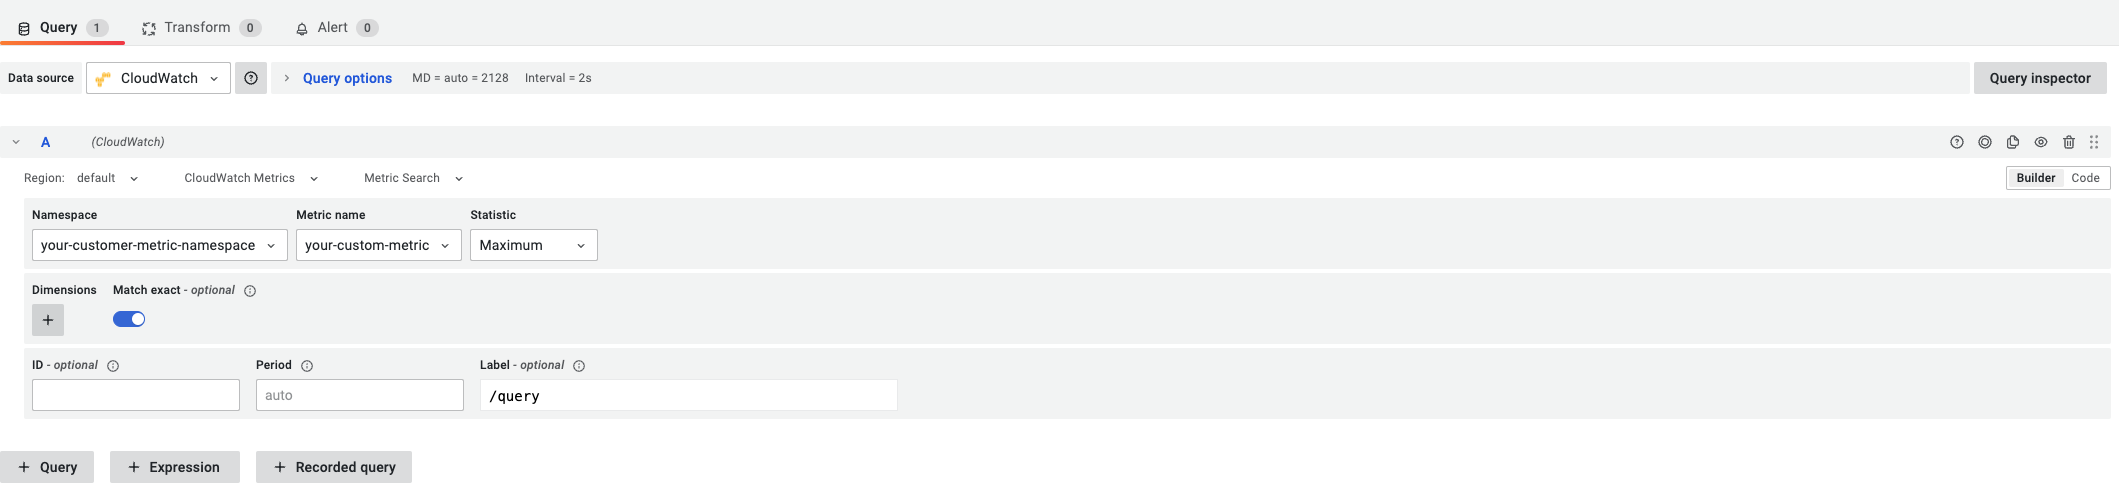
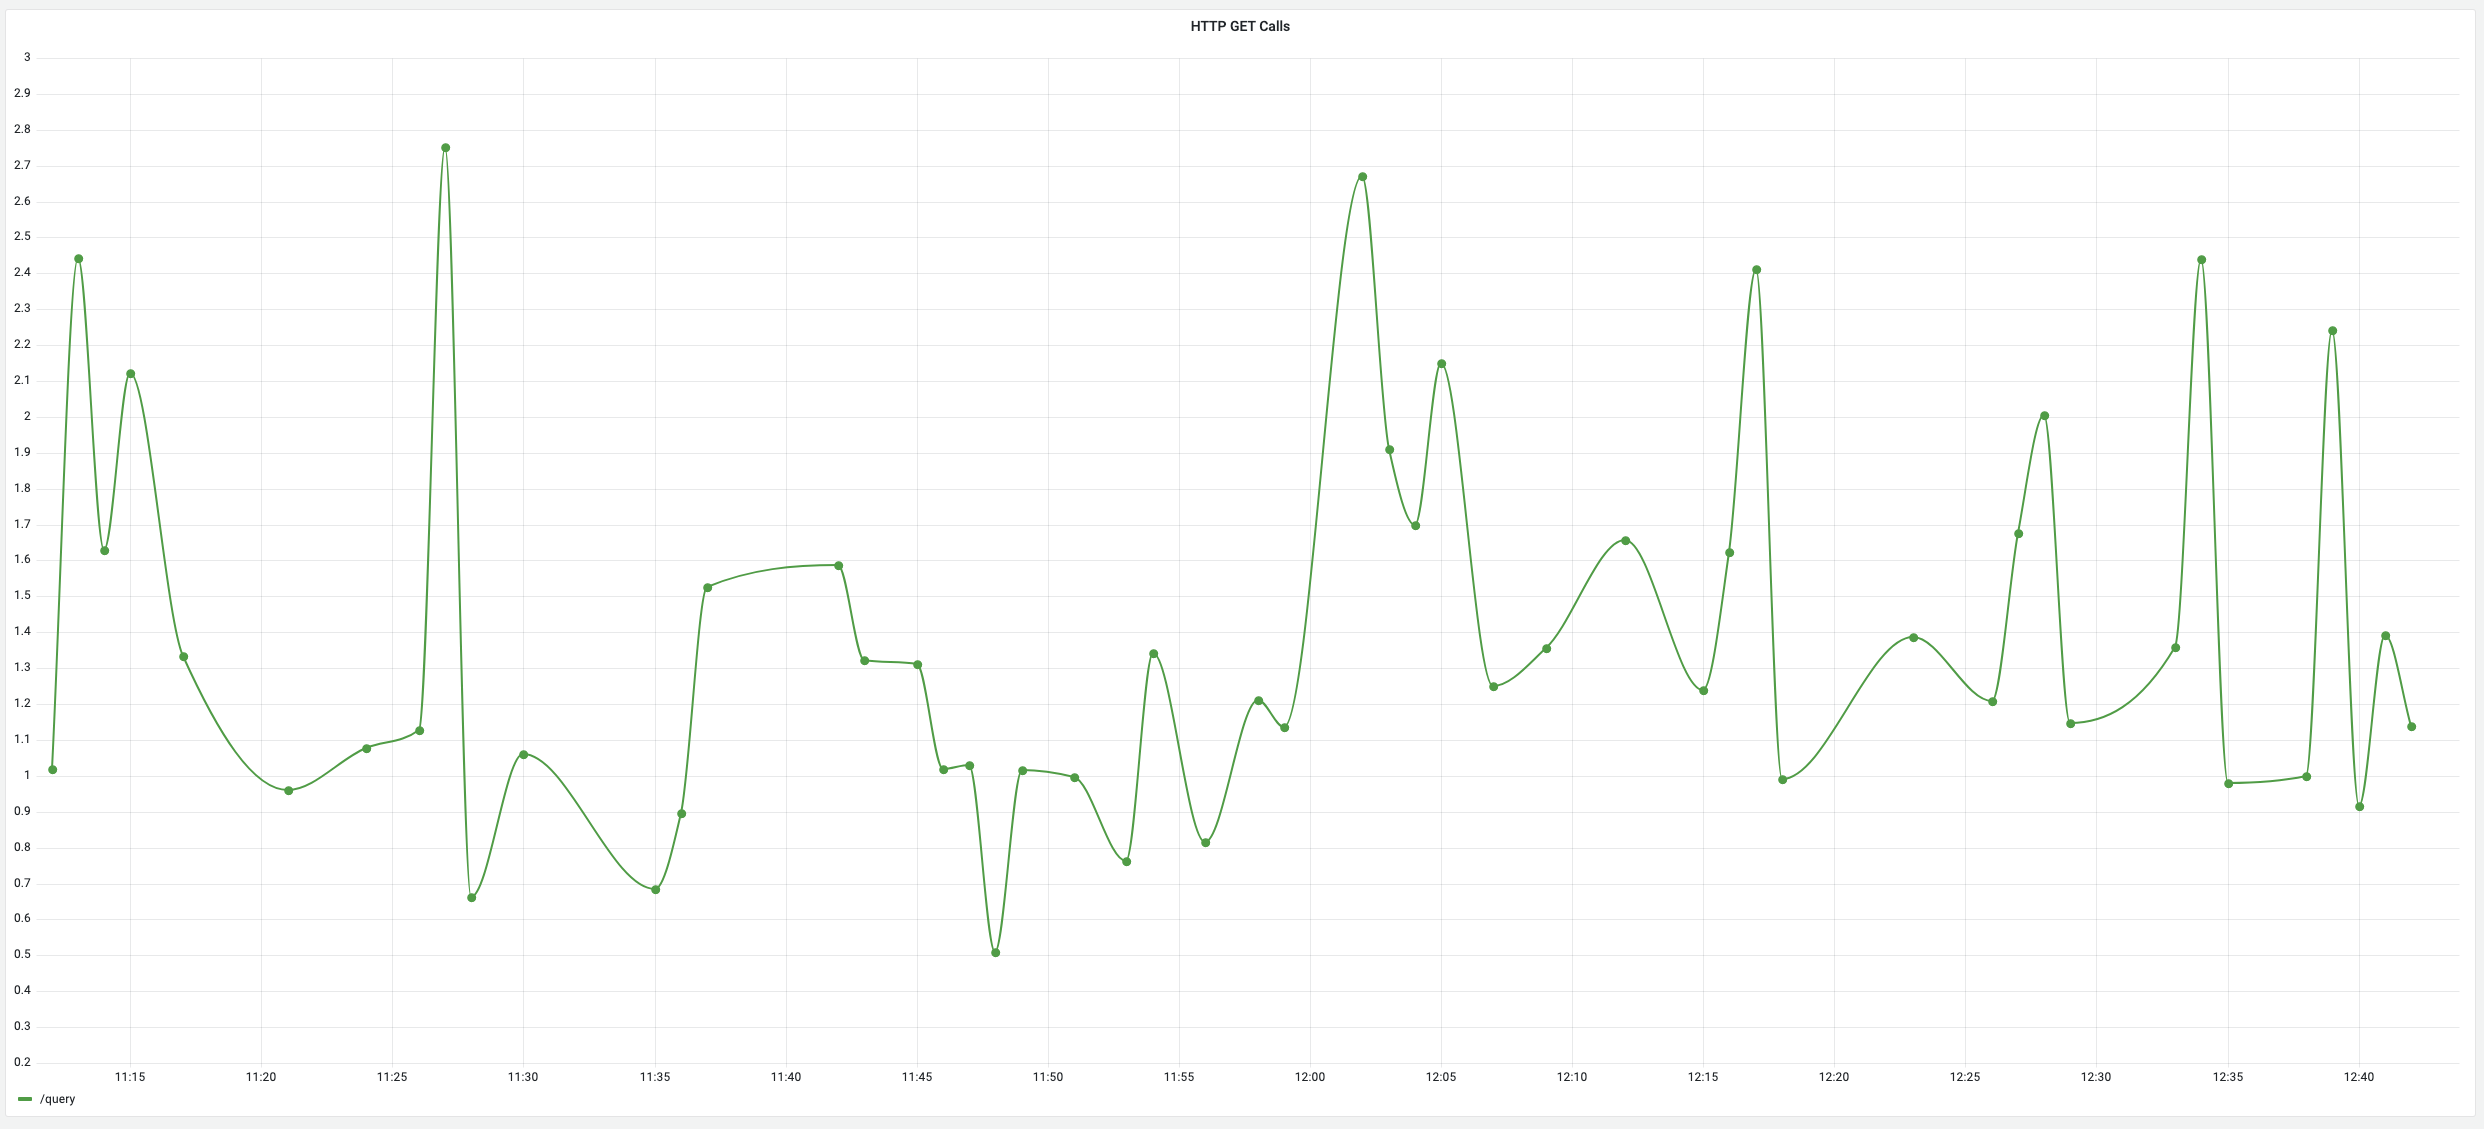
Finally, you should see a graph similar to the one below. This will let you visualize the performance of any endpoint you have a metric filter setup for and track the performance over time. Additionally, you can setup alerts on this graph and be notified when the endpoint performance deviates from your baseline.
In summary, we covered how we can leverage Nginx access logs to visualize the performance of your application endpoints. We also touched on when this might be useful to you and when you should consider more in-depth technologies that implement distributed tracing.